Grafana Integration
Overview
QuantaStor internally gathers it's metrics through Telegraf and InfluxDB. A user who wishes to set up their own custom dashboard separate from QuantaStor's own tools to view real time stats can also do so through other third party tools like Grafana which can also detect and visualize the data from InfluxDB. The following guide is to be used to help setup a custom Grafana dashboard alongside QuantaStor.
How to Install Grafana
On the Grafana downloads page underneath the header To install the latest Enterprise edition you can find instructions for the installation of Grafana on Debian or Ubuntu that goes as follows:
sudo apt-get install -y apt-transport-https
sudo apt-get install -y software-properties-common wget
sudo wget -q -O /usr/share/keyrings/grafana.key https://packages.grafana.com/gpg.key
Adding the following repository will keep your Grafana up-to-date on stable releases:
echo "deb [signed-by=/usr/share/keyrings/grafana.key] https://packages.grafana.com/enterprise/deb stable main" | sudo tee -a /etc/apt/sources.list.d/grafana.list
After these steps you can finish installation of Grafana with the commands:
sudo apt-get update
sudo apt-get install grafana-enterprise
Running the Grafana Server
To turn on and verify Grafana is working you should enter the following command lines:
sudo systemctl daemon-reload
sudo systemctl start grafana-server
sudo systemctl status grafana-server
The system should display Active: active(running) if everything is working properly.
If you want your Grafana server to automatically launch on boot you can enter the following command:
sudo systemctl enable grafana-server.service
Acquiring Username/Password for InfluxDB
Run the following command on your QuantaStor system and record the given username and password.
cat /etc/telegraf/telegraf.conf | grep "username\|password"
The credentials will be given in a format similar to this:
username = "quantastor"
password = "b15beec1-a400-fb47-d267-04eedd302c9a"
This is the username and password used to access your QuantaStor systems metrics via InfluxDB. Keep a record of the username and password to enter in at a later step.
How to log in to Grafana
Open up a browser and navigate to the IP address of the QuantaStor system followed by the port 3000, the default used to access Grafana. For example:
http://10.0.16.60:3000
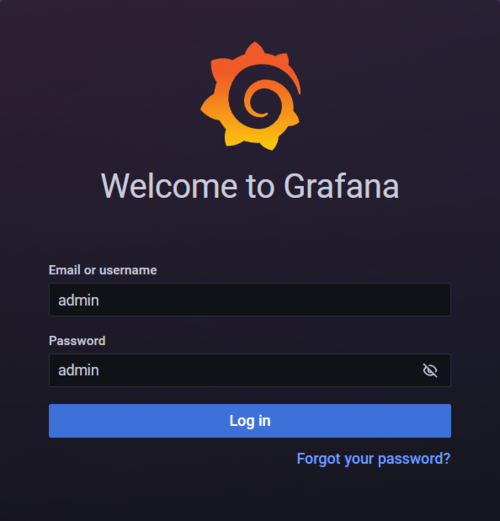
This will bring you to the login page of Grafana. The default username and password for this login screen is "admin". Once you successfully are logged in you'll be taken to the main page of Grafana.
*If prompted to set up a password for Grafana you can either select skip or set up a personal password
Set up InfluxDB as a Data Source
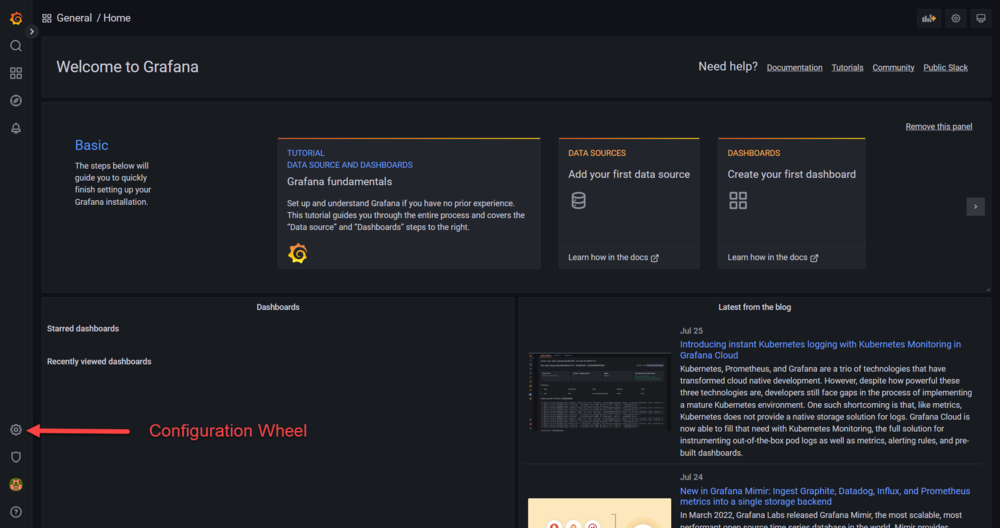
By default, the user has to select InfluxDB as a data source in order for Grafana to be able to detect and visualize the data from your QuantaStor system. This can be done by clicking on the Configuration wheel toward the bottom left of the screen (see image).
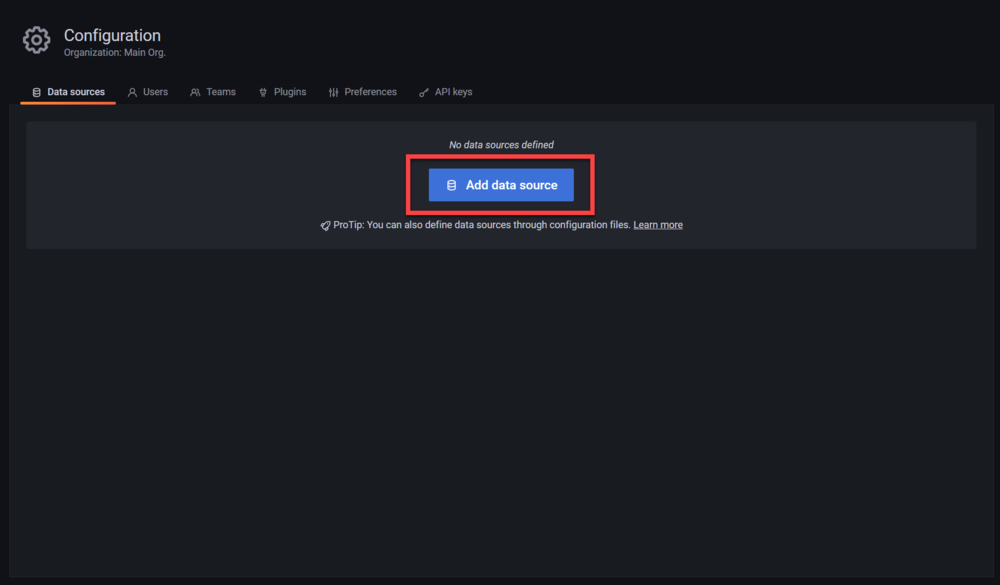
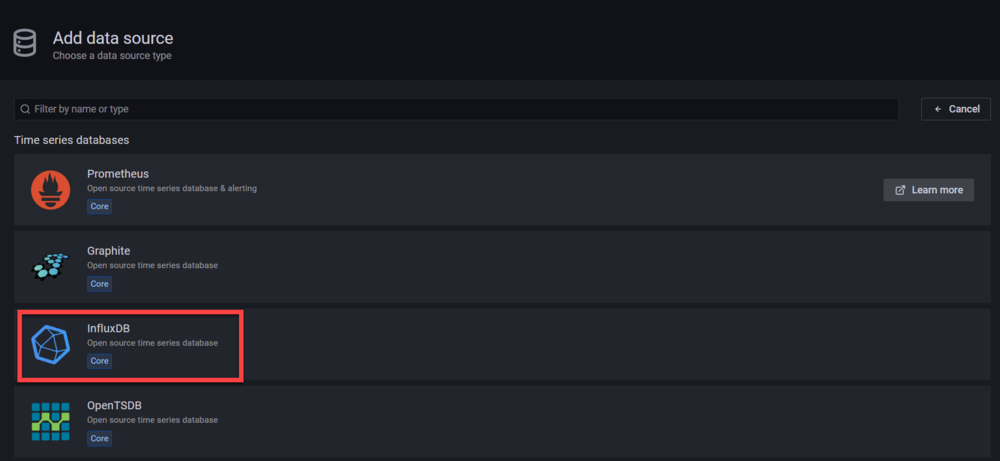
From this screen, you can click on the large Add data source button in the middle of the screen. This will bring you to a menu with numerous options to select from, choose InfluxDB.
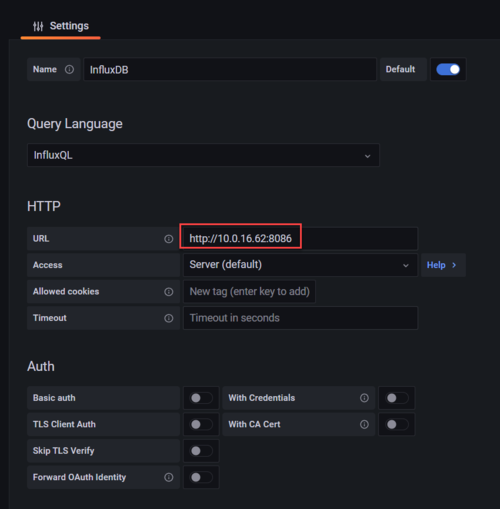
In this new menu for setting up the InfluxDB data source under the HTTP header set the url to the IP address of the QuantaStor system followed by the default port used by Grafana, 8086. For example:
http://10.0.16.60:8086
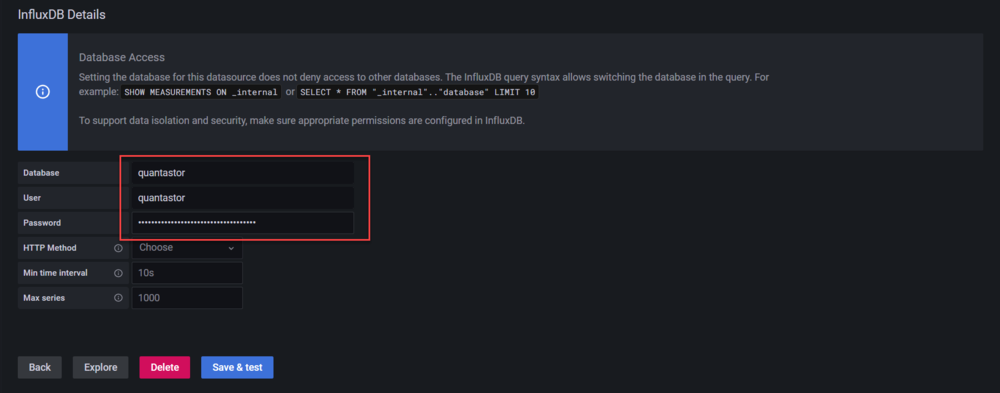
For the next step, under the InfluxDB Details header enter 'quantastor' into the Database and User fields. The password is the same as the password previously found in the Acquiring Username/Password for InfluxDB section of this guide.
Once all mentioned fields are filled click on Save & Test toward the bottom of the screen. This will result in an alert that the data source is working if everything is functional. Now Grafana is ready to create custom advanced dashboards for your QuantaStor system.
Setting up a Test Dashboard in Grafana
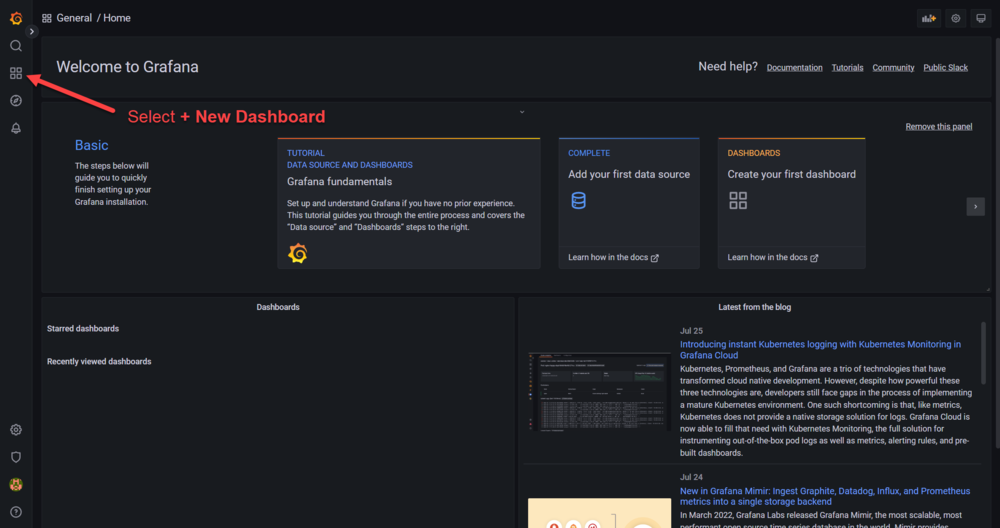
It can be a good idea to set up an initial simple test dashboard in order to make sure that everything is working properly. To do so in Grafana, hover over the four-cube icon on the left bar and select + New Dashboard.
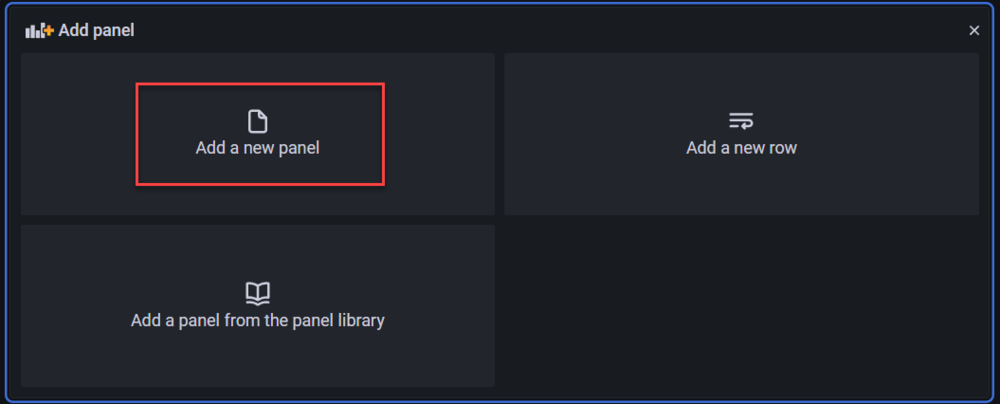
On this new screen, select Add a new panel inside of the Add panel box.
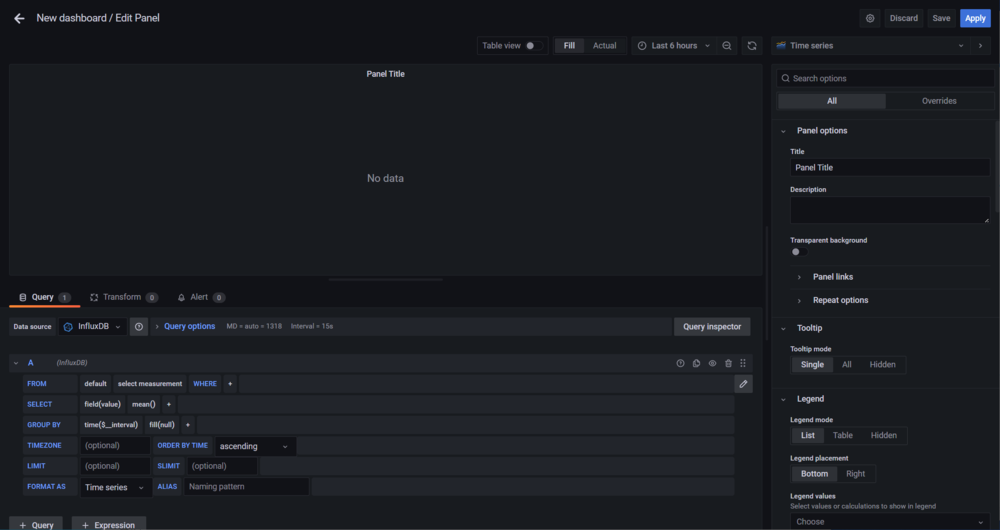
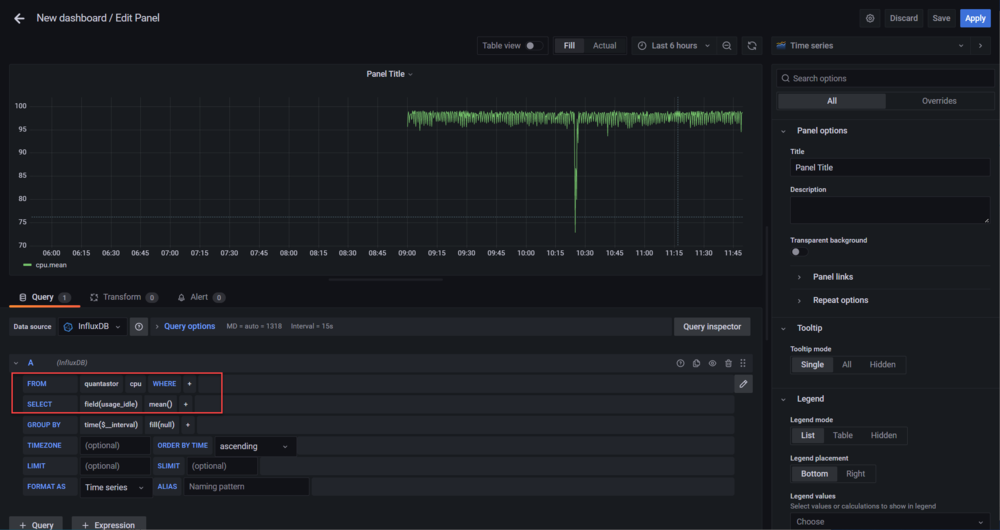
This will bring up the Edit Panel for your new dashboard. In this space, you are able to make custom dashboards to fit your personal needs. For the initial test, in the FROM horizontal column click on default and select quantastor. Next, click on select measurement and choose cpu. Finally, under the SELECT horizontal column change field(value) to field(usage_idle). After you've changed all of the mentioned fields the graph will now be showing a visualization of the chosen data from your QuantaStor system.
Before image of Edit Panel
After image of Edit Panel
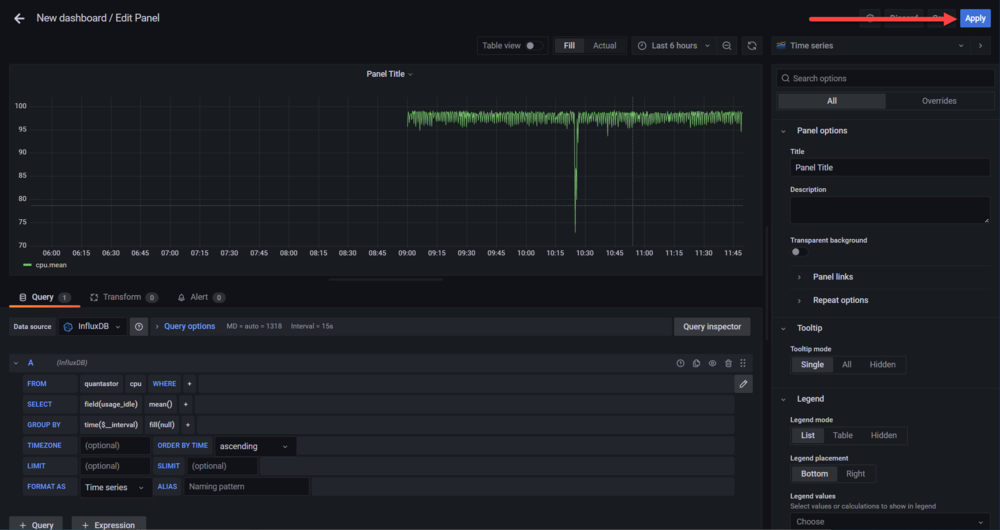
To save this panel to your new dashboard click on Apply in the top right of the screen.
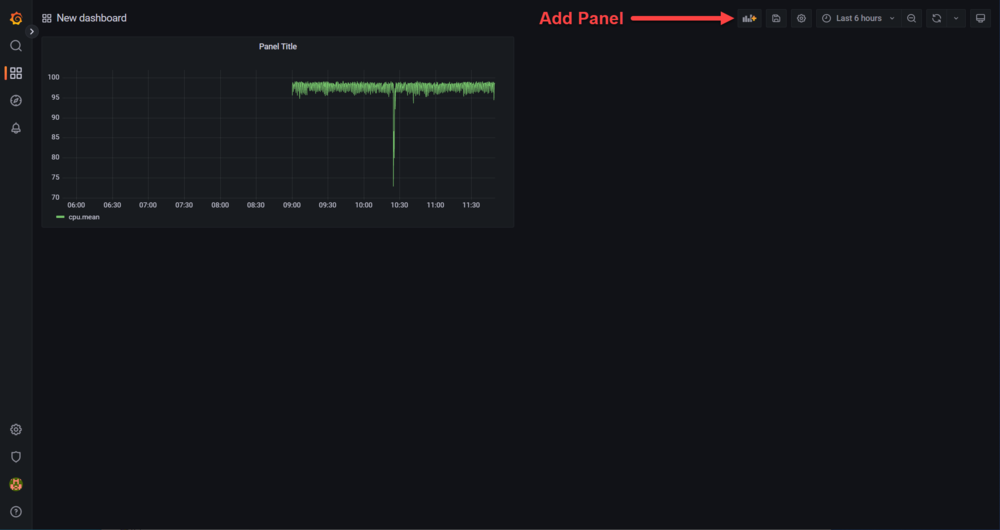
After that you'll be brought back to your dashboard, which now has a panel displaying the chosen metrics. If you want to create additional panels for this dashboard you can press the Add panel icon near the top right of the screen. You can also edit the name and additional settings of the dashboard by clicking on the Dashboard settings wheel towards the top right of the page near the Add Panel icon.
Grafana is now fully set up to create custom dashboards for QuantaStor that allows you to choose which specific metrics you wish to be displayed.
QuantaStor Performance Counters
QuantaStor uses the InfluxData's InfluxDB as well as TICK Stack (Telegraf, InfluxDB, Chronograf,Kapacitor collectively called the TICK Stack.). Therefore, various InfluxDB Telegraf Input Plugins are enabled for gathering performance metrics within QuantaStor. The list below shows the plugins enabled, links to the fields they support, and a list of currently supported fields within the QuantaStor Web Management application.
QuantaStor currently does not use Kapacitor. Any InfluxDB Telegraf input plugins not listed must be requested and certified through OSNEXUS.
InfluxDB Telegraf Input Plugins Supported and Configured by QuantaStor
- inputs.system
- inputs.cpu
- inputs.mem
- inputs.net
- inputs.disk
- inputs.diskio
- inputs.swap
- inputs.zfs
- inputs.ceph
Measurement Fields Used by QuantaStor Web Management Application
- "cpu"
- usage_iowait
- usage_idle
- usage_system
- "mem"
- used_percent
- "net"
- bytes_sent
- bytes_recv
- "diskio"
- write_bytes
- read_bytes
- writes
- reads
- "zfs_pool"
- nread
- nwritten
- reads
- writes
- "ceph"
- op_w_in_bytes
- op_r_out_bytes
- op_r_latency.avgcount
- op_w_latency.avgcount
- op_r_latency.avgtime
- op_w_latency.avgtime
- "ceph_pool_stats"
- write_bytes_sec
- read_bytes_sec
- write_op_per_sec
- read_op_per_sec
- "zfs"
- arcstats_hits
- arcstats_mru_hits
- arcstats_mfu_hits
- arcstats_size
- arcstats_c
- arcstats_c_max
- arcstats_c_min

