Librato Metrics Integration
Metrics takes away the headaches of traditional server based monitoring solutions that take time to set up, require investments in hardware and take effort to maintain. Metrics is delivered as a service so you don't have to worry about storage, reliability, redundancy, or scalability.
Setup for Librato Metrics
|
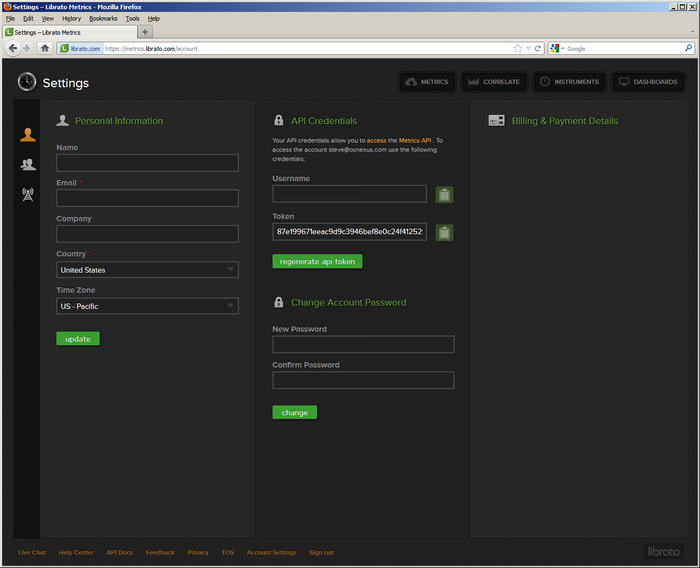
To post data to Librato Metrics you first must have a Librato Metrics account, which can be created through their website at https://metrics.librato.com. Next you will want to go to your account settings page. This is where you will find your username (email used to create the account) and your API token. This token will be used to post data. At this screen you can do other things such as change your password, or generate a new API token. | |
|
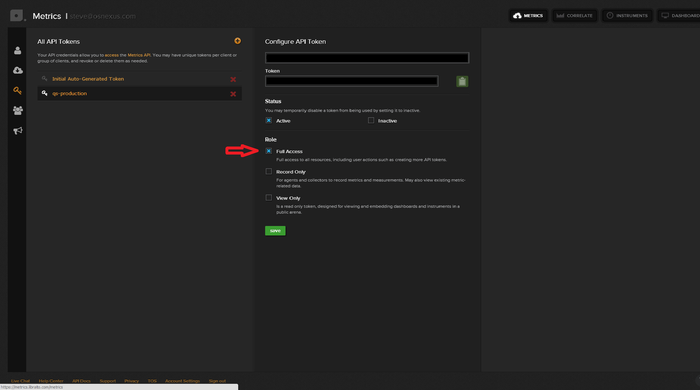
When you create the API token, make sure that it is set to "Full Access". This will allow us to create the different Instruments and Dashboards. | |
|
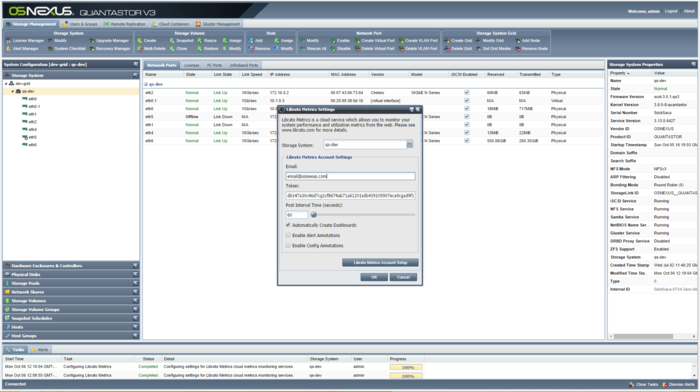
The next step is to configure Quantastor to post data to Librato Metrics using the same API token. Right click on the storage system you wish to post data, and select the Librato Metrics settings. In the dialog that appears set your username as the email you use to log into Librato Metrics. Paste the token from the Librato Metrics site into the token field. The post interval allows you to change how often Quantastor will send data to Librato Metrics. The default value is 60 seconds. Click "OK", and Quantastor should begin posting data. |
Viewing the Metrics
To view the data you will first sign into your Librato Metrics account. After signing in click on the "Metrics" tab along the top. This will bring you to a list of all the metrics that have been posted to your account. Quantastor uses a naming convention of: "<storage system/grid name> - <gauge name>"
Quantastor creates the following gauges:
|
Metrics |
|
|
Instruments |
|
Examples
|
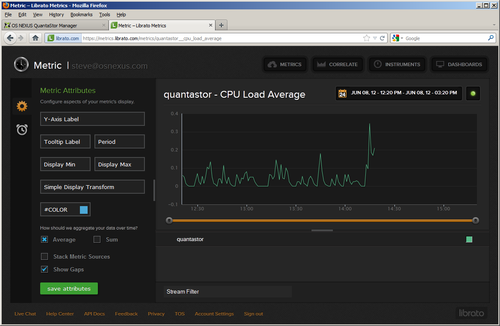
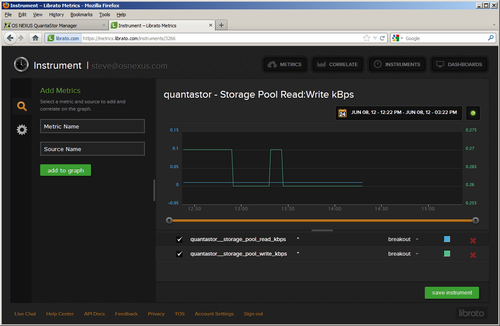
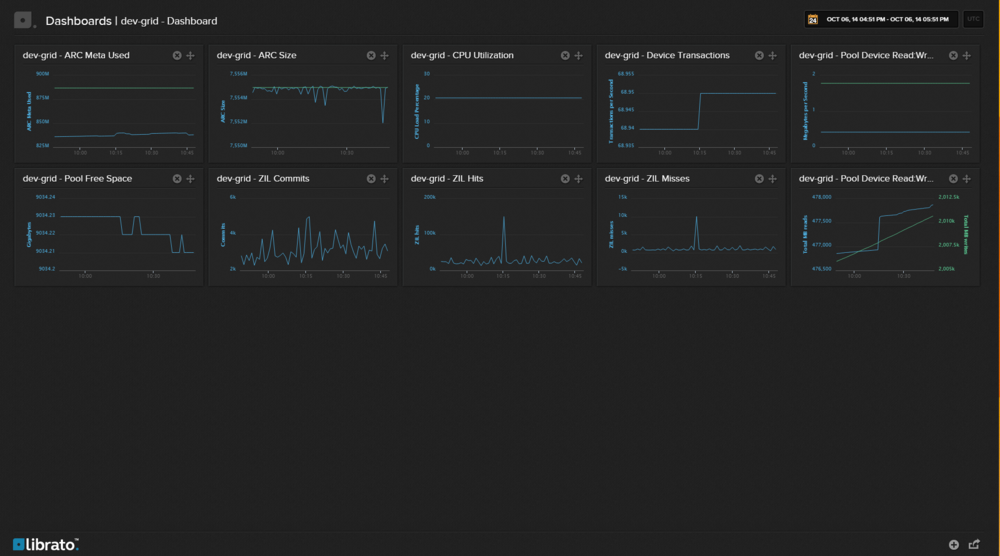
The picture on the left shows an example of a gauge Metric. This graph is the CPU load averages Metric. In the top right corner of the graph you can change the window of time that is currently being viewed. To the right of that is an example of an Instrument. An Instrument is a combination of of different Metrics. In this Instrument the Storage Pool Read kBps and Write kBps have been combined into one graph. |
|
|
Librato Metrics Configuration Troubleshooting
If you've setup Librato metrics and are not seeing information show up in your Librato account the first thing to do is to verify your network settings. To do so you'll need to login to your QuantaStor System at the console or via SSH as qadmin. After you login run this command to see if you can ping the Google web site, currently the Metrics web site doesn't respond to ping:
ping www.google.com
If the ping is unsuccessful then the system has a bad gateway or DNS configuration. The next step would be to ping Google's DNS server like so:
ping 8.8.8.8
If the ping is successful then the system's gateway settings are good but the DNS settings are bad. If the ping is unsuccessful then the system's gateway settings are bad and the DNS may also be bad. For more information on setting the DNS settings for your system please see the Storage System Modify documentation here.
Gateway settings are configured per network adapter and we recommend that you only configure the gateway on a single network interface.
If both of those are working fine then please contact OSNEXUS (support@osnexus.com) or Librato support.
