Chronograf Integration
Overview
QuantaStor has numerous real-time stats dashboards built into the main web management user interface that cover what most users and administrators need. In some cases though it can be useful to have visibility into other metrics and to be able to setup custom dashboards for visualizing performance and other historical storage information. QuantaStor internally uses Telegraf and InfluxDB to collect and store real-time stats and these can be easily used by other open source dashboard systems like Chronograf to make custom displays. The following instructions go over how to setup Chronograf with QuantaStor so that these advanced dashboards may be setup.
How to Install Chronograf
Go to the Chronograf downloads page to get the latest version. Next, click the version button under the Chronograf section (for example, "v1.7.12" button) and navigate to the "Unbuntu & Debian" install section and follow the instructions in the "Unbuntu & Debian" section. For example:
sudo wget https://dl.influxdata.com/chronograf/releases/chronograf_1.8.9.1_amd64.deb
sudo dpkg -i chronograf_1.8.9.1_amd64.deb
How to Login to Chronograf
Record the InfluxDB "username" and "password" for the QuantaStor system by logging into your QuantaStor system and executing:
cat /etc/telegraf/telegraf.conf | grep "username\|password"
You will see the InfluxDB credentials in the telegraf.conf file that will looks something like this:
  username = "quantastor"
  password = "b15beec1-a400-fb47-d267-04eedd302c9a"
Next, launch Chronograf in Chrome by navigating to the IP address of the QuantaStor system at port 8888. For example:
http://10.0.16.60:8888
Enter the InfluxDB username and password credentials you recorded when prompted. To see a system context diagram of Telegraf+InfluxDB+Chronograf please see: https://www.influxdata.com/time-series-platform/chronograf/ You are now ready to create a custom QuantaStor dashboard using Chronograf!
How to Create a Chronograf Custom Dashboard
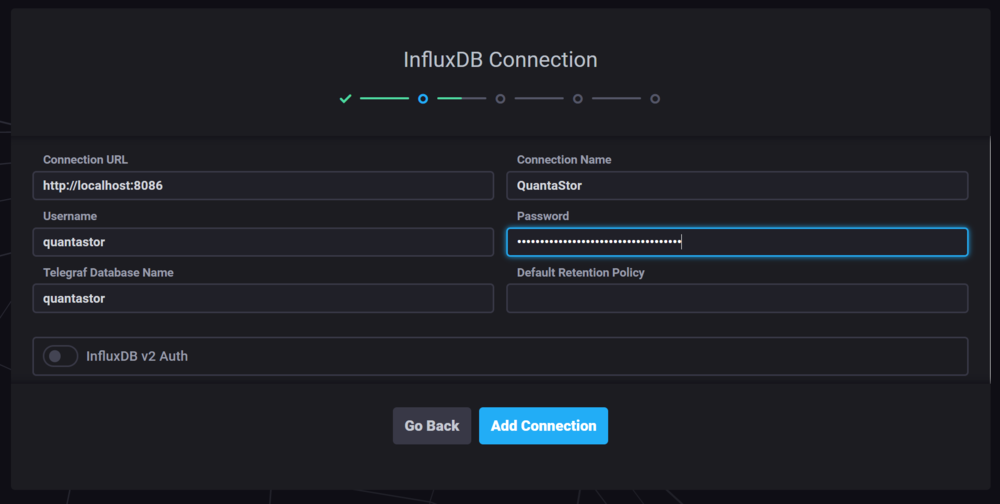
After connecting to your QuantaStor system at the above 8888 port number you should be presented with the web management interface for Chronograf. The default http://localhost:8086 is the correct address for Chronograf to communicate with InfluxDB internal to the service. For the Connection Name we recommend calling it the name of your QuantaStor system or just QuantaStor. Similarly the name of the InfluxDB database is quantastor and the username for the database is also quantastor. The password to access InfluxDB is gathered by the above command and is a UUID you'll need to paste into the password field after you've gathered it from the telegraph.conf file.
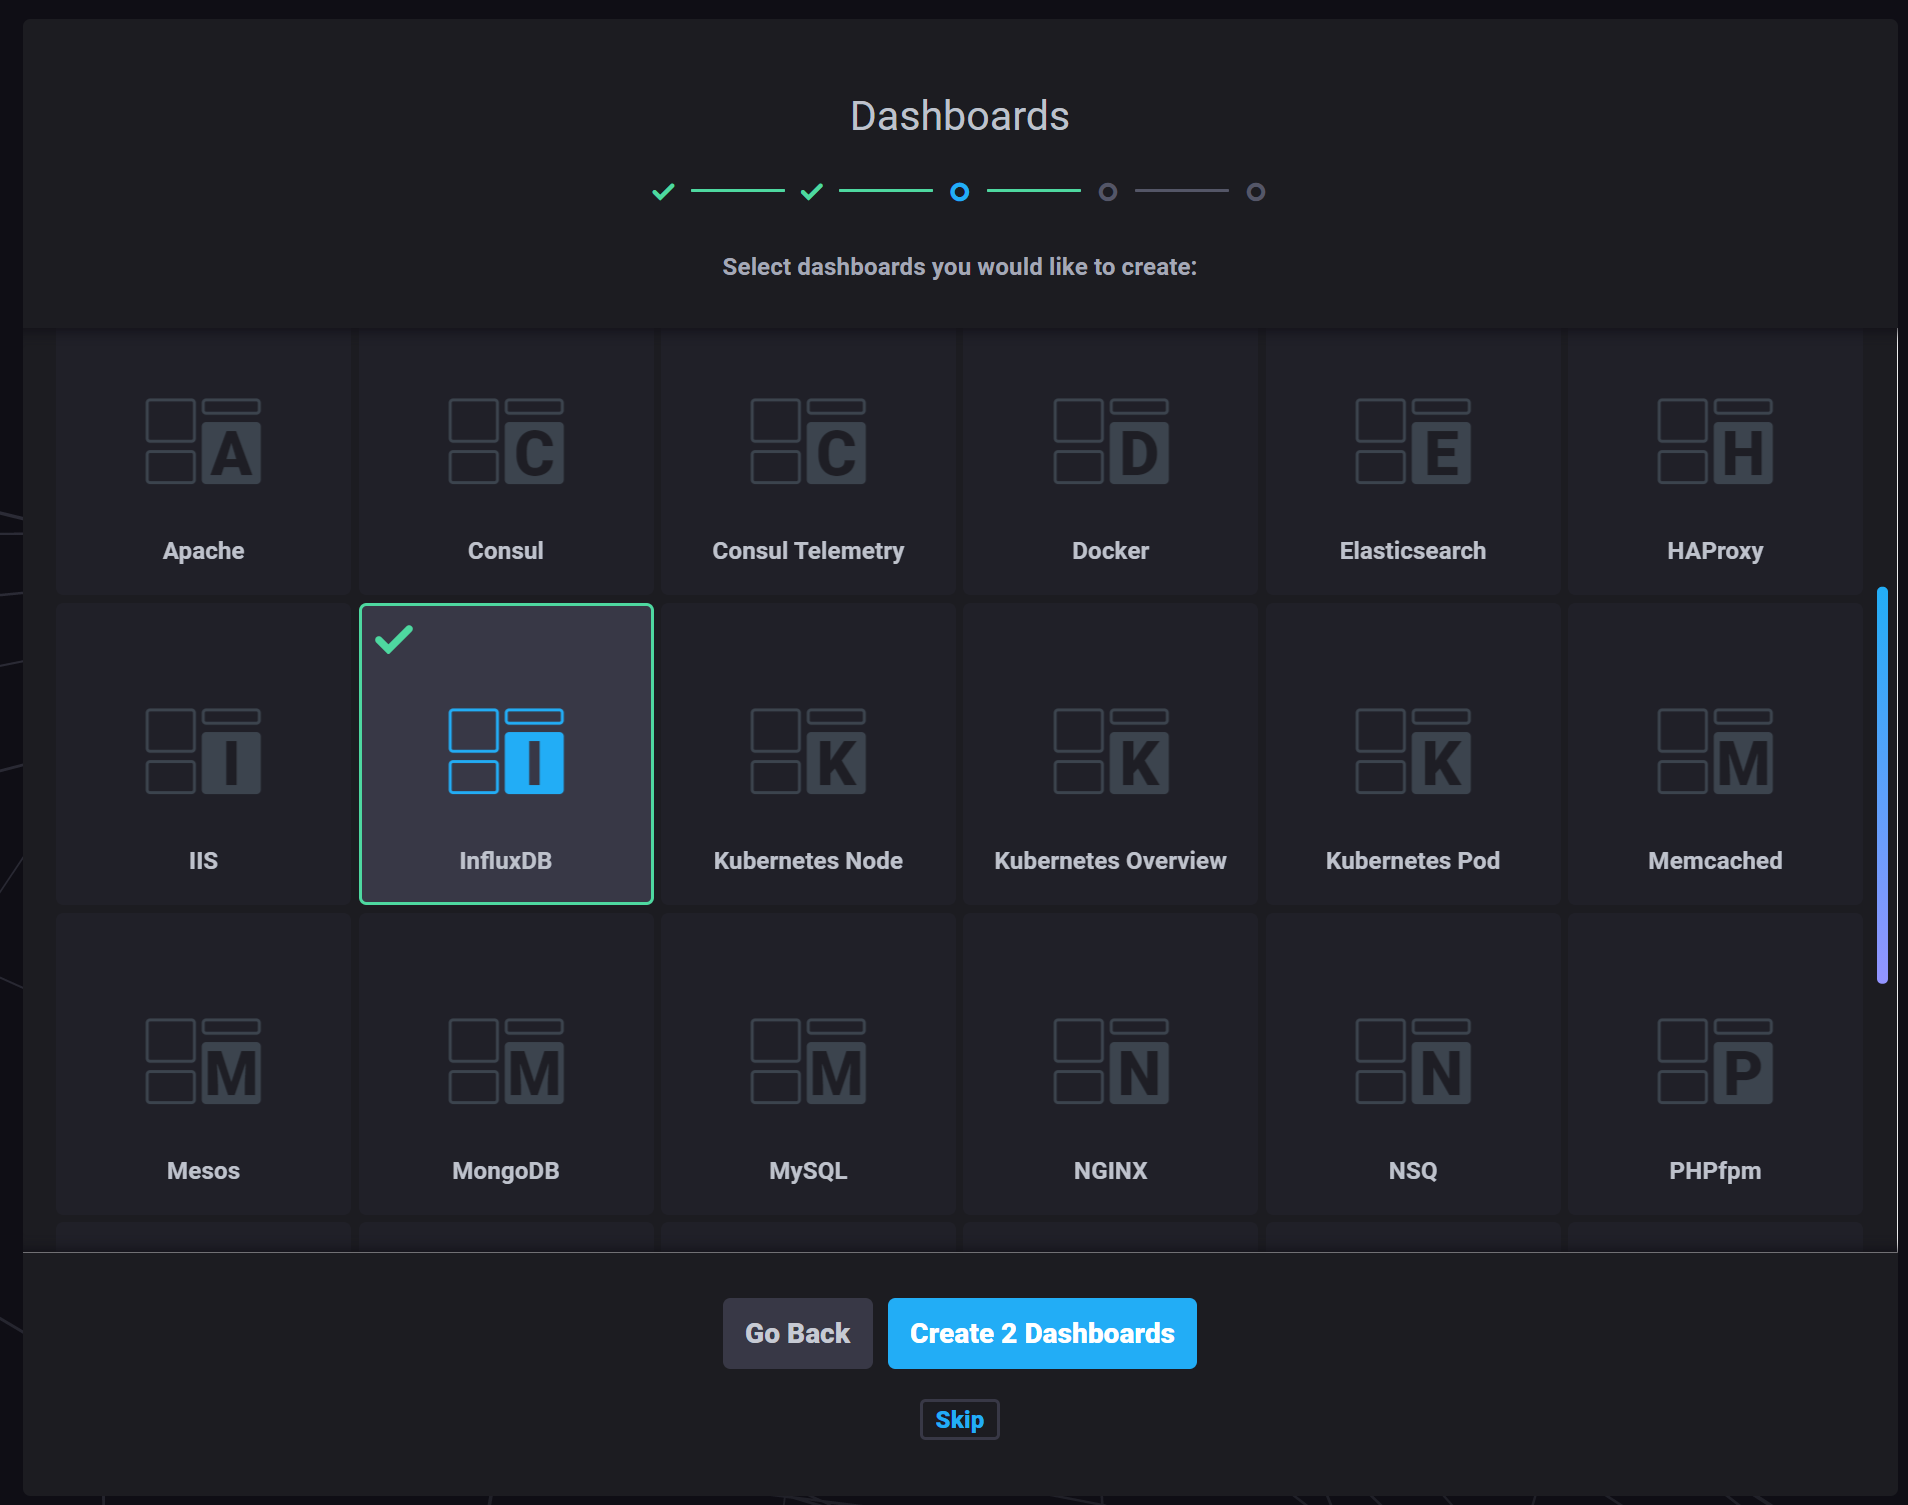
Once you've added a InfluxDB Connection it will now ask you to create a dashboard. I recommend selecting the InfluxDB option, then choose create.
Now you should see that connection in the green Connected state. Next, look to the left edge of the screen and select the icon to begin exploring the data.
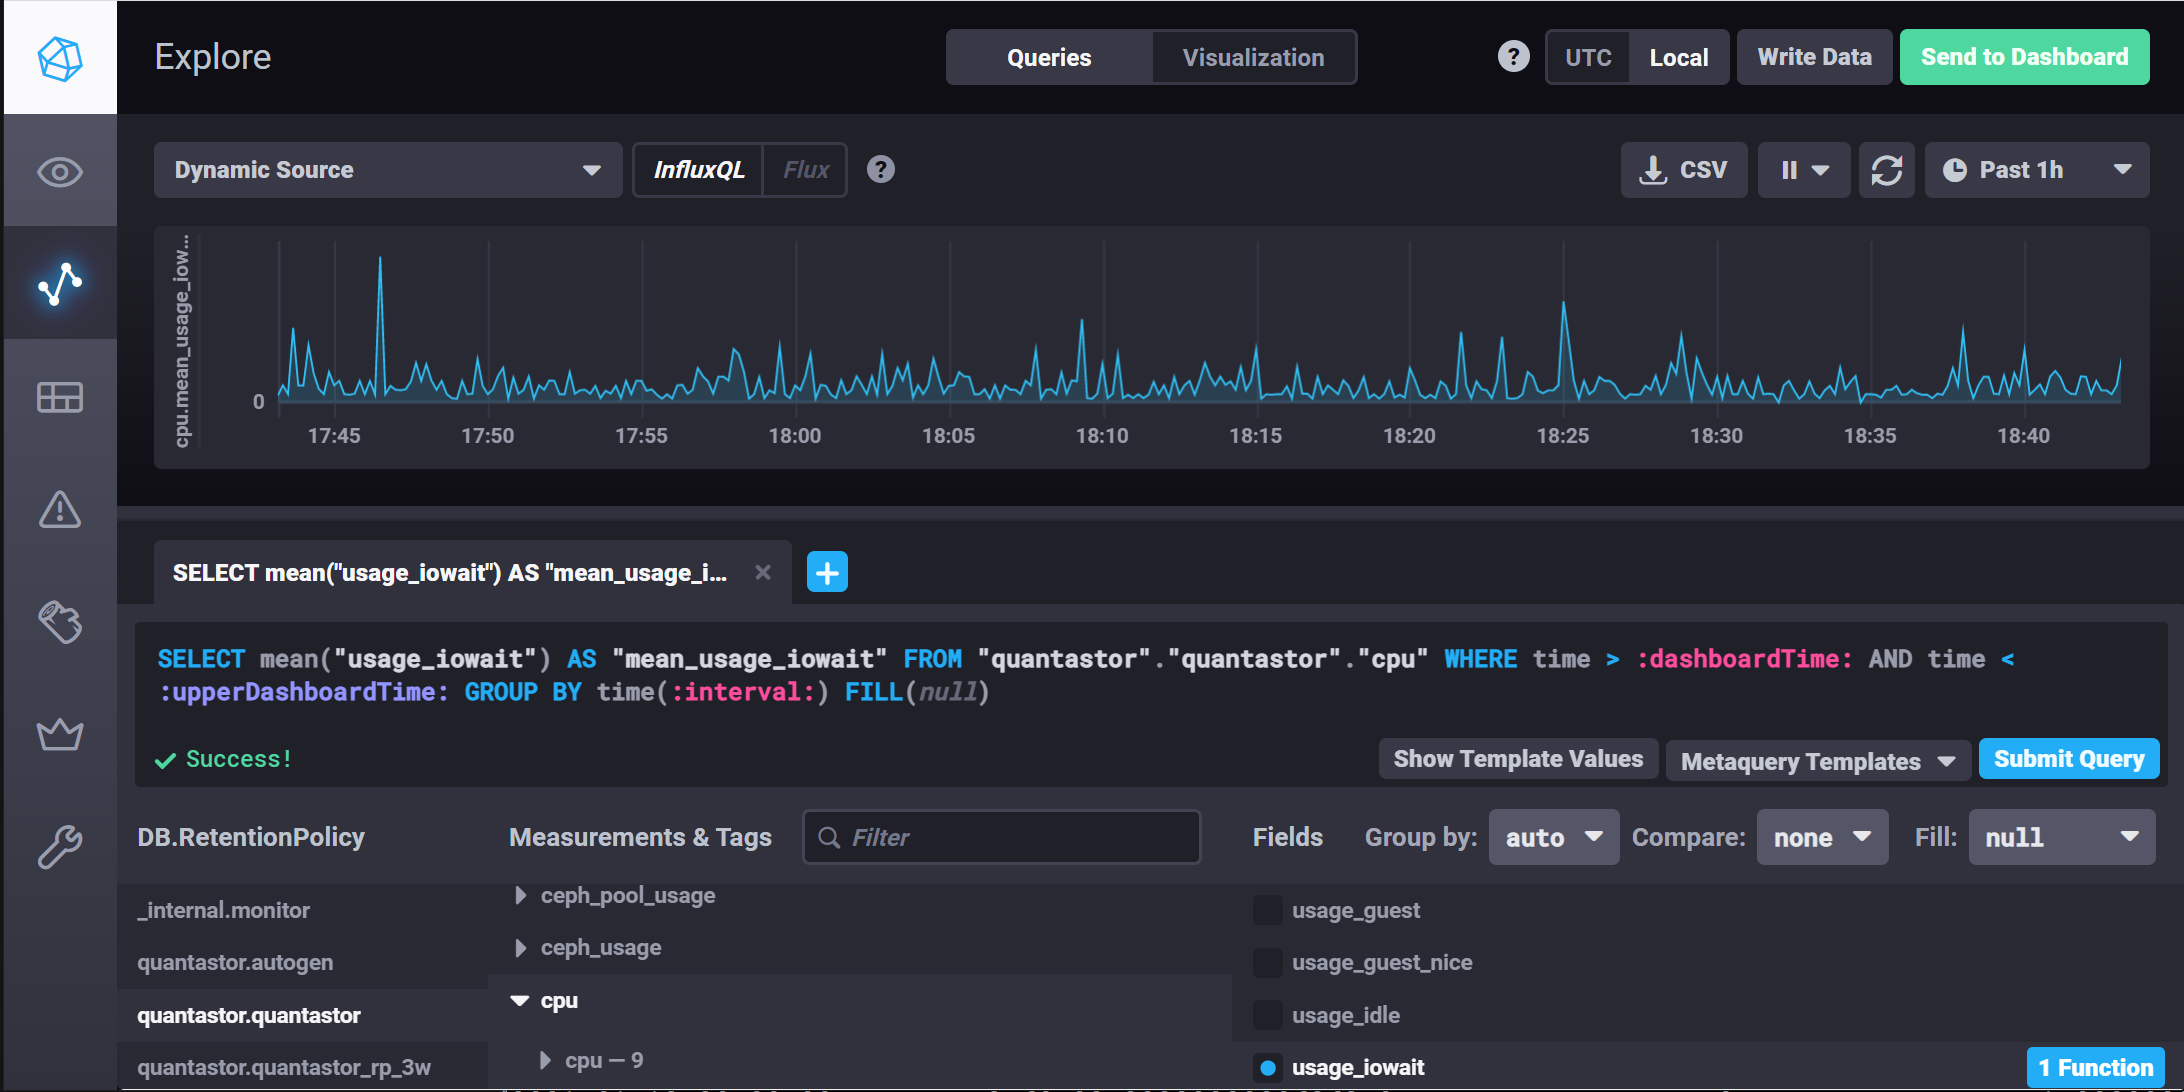
When you're initially starting to explore the data we recommend looking at the cpu data as that will help verify that everything is working. To do this, choose the quantastor.quantastor database in the DB.RetentionPolicy section, then select the cpu measurement and then select the usage_iowait Field. You should see a graph similar to the one shown below.
- Launch Chronograf in Chrome: http://ip-address-of-where-you-installed-chronograf:8888
- Enter the InfluxDB credentials you recorded when prompted.
- Click the Dashboards Menu/Icon
- Click "+ Create Dashboard" button
- Name your dashboard by typing over the "Name This Dashboard" text
- Click "+ Add Data" or "+ Add Cell" button"
- Click quantastor.quantastor
- Select what you want to monitor in "ceph" and title your graph by replacing the "Untitled Graph" text
- For example, title your graph using the names of the fields you select for monitoring.
- Click the ""Visualization"" button to change chart types
- Change sample time in the dropdown combo in upper RHS. e.g. Change "Past 5m" to "Past 24h"
For additional information, see:
- Creating a dashboard tutorial- https://docs.influxdata.com/chronograf/v1.7/guides/create-a-dashboard/
- Hiding regions in a dashboard- https://docs.influxdata.com/chronograf/v1.7/guides/presentation-mode/
- Using pre-created dashboards- https://docs.influxdata.com/chronograf/v1.7/guides/using-precreated-dashboards/
- Gettings started with pre-created dashboards- https://dzone.com/articles/how-predefined-dashboards-in-influxdatas-chronogra
- Advanced: Chronograf and Dashboarding- https://www.influxdata.com/training/advanced-chrongraf-and-dashboarding/?aliId=eyJpIjoiTkJ1ZkxjaG44R3FFVElHTSIsInQiOiJKRVNhSmpNR2RiRklmR2RyY2FqRzJRPT0ifQ%253D%253D
Chronograf JSON Details
- Get and Post Chronograf Dashboards Examples:
- Chronograf API:


