Chronograf Integration
Overview
QuantaStor has numerous real-time stats dashboards built into the main web management user interface that cover what most users and administrators need. In some cases though it can be useful to have visibility into other metrics and to be able to setup advanced custom dashboards for visualizing performance and other historical storage information. QuantaStor internally uses Telegraf and InfluxDB to collect and store real-time stats and these can be easily used by other open source dashboard systems like Chronograf to make custom displays. The following instructions go over how to setup Chronograf with QuantaStor so that these advanced dashboards may be setup. Chronograf is automatically installed with QuantaStor.
How to Login to Chronograf
Record the InfluxDB "username" and "password" for the QuantaStor system by logging into your QuantaStor system and executing:
cat /etc/telegraf/telegraf.conf | grep "username\|password"
You will see the InfluxDB credentials in the telegraf.conf file that will looks something like this:
  username = "quantastor"
  password = "b15beec1-a400-fb47-d267-04eedd302c9a"
Next, launch Chronograf in Chrome by navigating to the IP address of the QuantaStor system at port 8888. For example:
http://10.0.16.60:8888
Enter the InfluxDB username and password credentials you recorded when prompted. To see a system context diagram of Telegraf+InfluxDB+Chronograf please see: https://www.influxdata.com/time-series-platform/chronograf/ You are now ready to create a custom QuantaStor dashboard using Chronograf!
How to Create a Chronograf Custom Dashboard
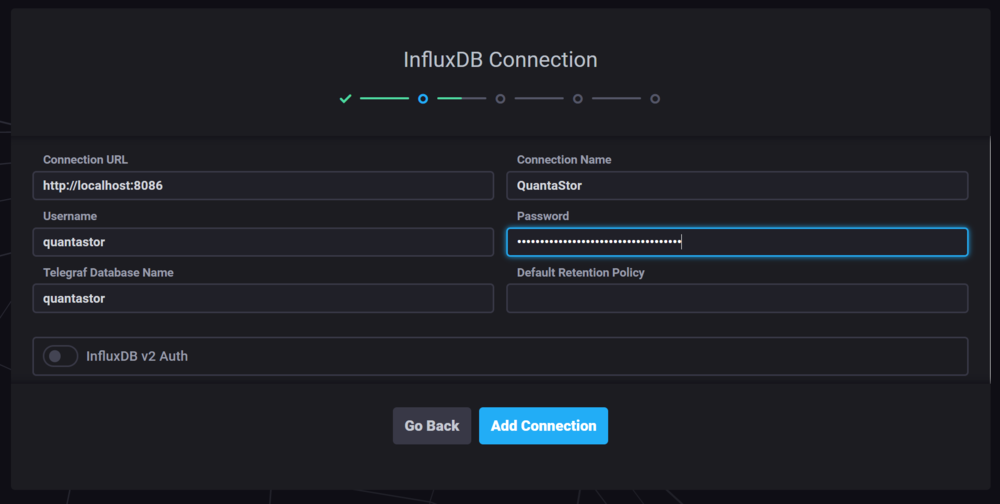
After connecting to your QuantaStor system at the above 8888 port number you should be presented with the web management interface for Chronograf. The default http://localhost:8086 is the correct address for Chronograf to communicate with InfluxDB internal to the service. For the Connection Name we recommend calling it the name of your QuantaStor system or just QuantaStor. Similarly the name of the InfluxDB database is quantastor and the username for the database is also quantastor. The password to access InfluxDB is gathered by the above command and is a UUID you'll need to paste into the password field after you've gathered it from the telegraf.conf file.
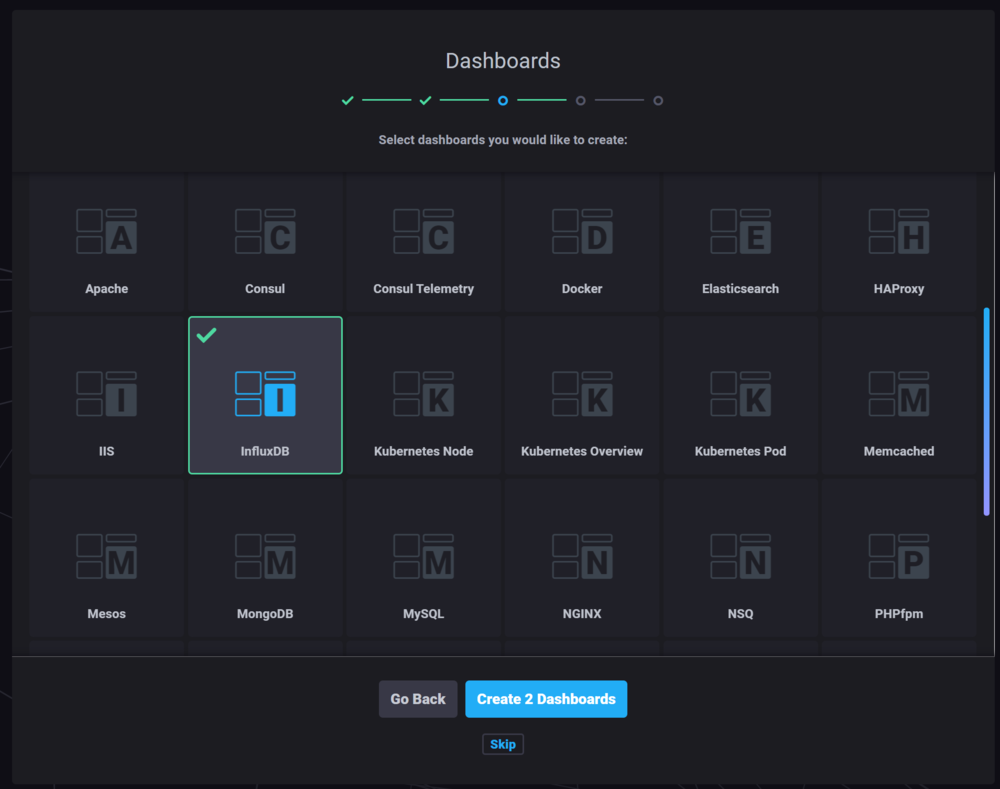
Once you've added a InfluxDB Connection it will now ask you to create a dashboard. You might select the InfluxDB option, then choose create but you don't need to create any dashboards at this time and you can skip this and create a new dashboard later once you've selected some graphs you want to select.
Now you should see that connection in the green Connected state. Next, look to the left edge of the screen and select the icon to begin exploring the data.
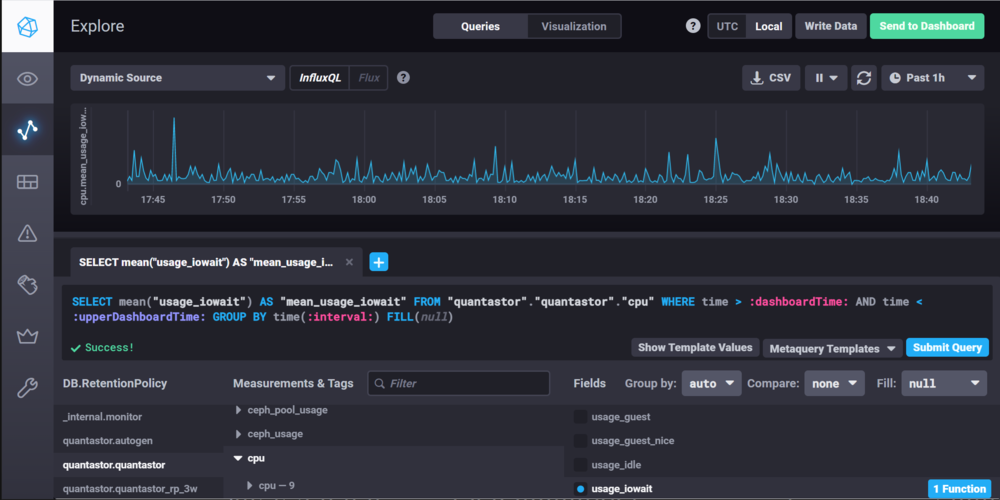
When you're initially starting to explore the data we recommend looking at the cpu data as that will help verify that everything is working. To do this, choose the quantastor.quantastor database in the DB.RetentionPolicy section, then select the cpu measurement and then select the usage_iowait Field. You should see a graph similar to the one shown below.
Building a Dashboard
Once you have information you want to display, press the green Send to Dashboard button in the upper right corner and add the graph to the dashboard of your choosing or make a new dashboard.
There's lots of information that QuantaStor is setup to collect which we don't display in the main QuantaStor web user interface so there's lots to explore. For further reading on how to customize and configure Chronograf dashboards we recommend the following:
Learning Chronograf Resources
- InfluxData - Creating a Dashboard Tutorial
- InfluxData - Hiding regions in a dashboard
- InfluxData - Using pre-created dashboards
- Dzone - Getting started with pre-created dashboards
- InfluxData - Advanced Chronograf and Dashboarding
QuantaStor Performance Counters
QuantaStor uses the InfluxData's InfluxDB as well as TICK Stack (Telegraf, InfluxDB, Chronograf,Kapacitor collectively called the TICK Stack.). Therefore, various InfluxDB Telegraf Input Plugins are enabled for gathering performance metrics within QuantaStor. The list below shows the plugins enabled, links to the fields they support, and a list of currently supported fields within the QuantaStor Web Management application.
QuantaStor currently does not use Kapacitor. Any InfluxDB Telegraf input plugins not listed must be requested and certified through OSNEXUS.
InfluxDB Telegraf Input Plugins Supported and Configured by QuantaStor
- inputs.system
- inputs.cpu
- inputs.mem
- inputs.net
- inputs.disk
- inputs.diskio
- inputs.swap
- inputs.zfs
- inputs.ceph
Measurement Fields Used by QuantaStor Web Management Application
- "cpu"
- usage_iowait
- usage_idle
- usage_system
- "mem"
- used_percent
- "net"
- bytes_sent
- bytes_recv
- "diskio"
- write_bytes
- read_bytes
- writes
- reads
- "zfs_pool"
- nread
- nwritten
- reads
- writes
- "ceph"
- op_w_in_bytes
- op_r_out_bytes
- op_r_latency.avgcount
- op_w_latency.avgcount
- op_r_latency.avgtime
- op_w_latency.avgtime
- "ceph_pool_stats"
- write_bytes_sec
- read_bytes_sec
- write_op_per_sec
- read_op_per_sec
- "zfs"
- arcstats_hits
- arcstats_mru_hits
- arcstats_mfu_hits
- arcstats_size
- arcstats_c
- arcstats_c_max
- arcstats_c_min
Chronograf API Resources
InfluxData - Get and Post Chronograf Dashboards Examples Chronograf API


