Grafana Ceph Dashboard & Prometheus Integration
Installing Prometheus, Node Exporter and Enabling Ceph Prometheus Module on Focal
1. Configure your Ceph Cluster using QuantaStor version 6.1 for Focal.
Run the following script to install Prometheus and dependencies. This script will also enable Ceph Prometheus Module.
2. Running the installer. Enter the following command from a console on one of your Ceph nodes.
install-ceph-prometheus
You have now successfully installed Prometheus, Node Exporter and Enabled Ceph Prometheus Module
Let us begin the grafana setup now
1. Login to Grafana (http://Your Server IP or Host Name:3000) with default username and password as admin
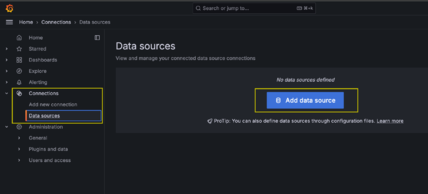
2. Hover the mouse over the Gear icon and click the ‘data sources’ menu item to add a new Prometheus data source
3. Click ‘Add data source’ and Select Prometheus
4. Enter URL of Prometheus and set the HTTP Timeout to 60 and the Scrape Interval to 15s. Click Save & Test.
For example, http://localhost:9090. Note: those dimmed grayed-out default on this page are Grafana’s default suggestions and not actual values, you must enter in a value. Values will be shown in a white font.
After clicking Save & Test you should see the status:
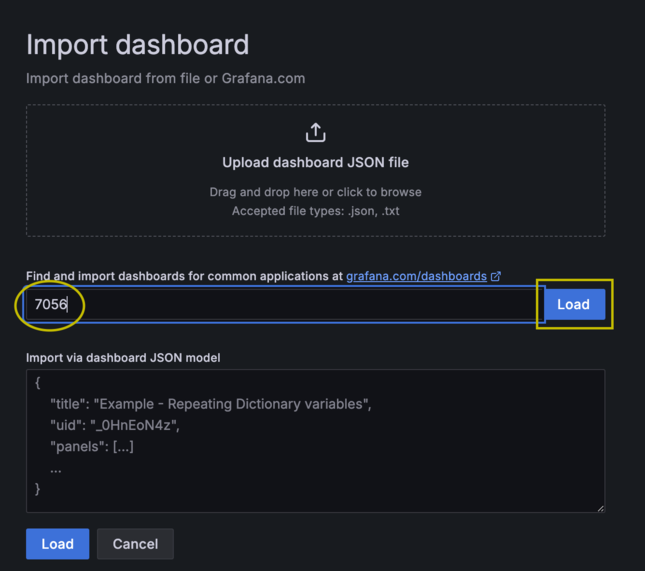
5. Hover the mouse over the Dashboards icon, and click on the Import menu item. Enter the Ceph cluster Grafana dashboard id "7056" in the ‘Import via Grafana.com’ field and click Load.
6. Optionally change the Name field and select the Ceph Prometheus data source you just added in the previous step.
Finally, we have successfully integrated our Ceph Cluster with Prometheus, Node Exporter and Grafana!
Ceph Cluster #7056
Using this setup process, you can now monitor your Ceph cluster and import other similar Grafana dashboards.
Other Ceph Dashboards tested that work following the same import process:
CephFS #9340
Ceph - OSD (Single) #5336
Ceph Pools #5342
References and Credits
1. Prometheus Module - Ceph Documentation, https://docs.ceph.com/en/quincy/mgr/prometheus/
2. Prometheus’s port registry, https://github.com/prometheus/prometheus/wiki/Default-port-allocations
3. 'Ceph Cluster monitoring using Prometheus and Grafana' by Ajinkya Ingole, https://dev.to/ingoleajinkya/ceph-cluster-monitoring-using-prometheus-and-grafana-472i
4. Example script that installs Prom/Grafana/Ceph, https://gist.github.com/kalaspuffar/b0faa4089b7f3920dbafbcedcccbaf16
5. Dashboard Guide - RED HAT CEPH STORAGE 5- Monitoring Ceph Cluster with Ceph Dashboard, https://access.redhat.com/documentation/en-us/red_hat_ceph_storage/5/html-single/dashboard_guide/index#doc-wrapper
6. Prometheus Installation Script for Ubuntu 16.04 and 18.04 LTS, https://github.com/petarnikolovski/prometheus-install


