Difference between revisions of "Performance Monitoring"
m (→Grid Dashboard Overview) |
m (→Grid Dashboard Overview) |
||
| Line 4: | Line 4: | ||
The Grid Dashboard found on the Main Tab gives a quick visual overview of the Grid's health status. Alert messages can be quickly viewed. Power status and System temperatures are displayed. Network connections and Pool status are also visible. The color of the System Tile's Alert button will be represented in standard IT health colors (e.g., orange represents Warning). | The Grid Dashboard found on the Main Tab gives a quick visual overview of the Grid's health status. Alert messages can be quickly viewed. Power status and System temperatures are displayed. Network connections and Pool status are also visible. The color of the System Tile's Alert button will be represented in standard IT health colors (e.g., orange represents Warning). | ||
| − | '''Note:''' Overview Tiles with Alerts will be will be represented in standard IT health colors (e.g., orange represents Warning while Red | + | '''Note:''' Overview Tiles with Alerts will be will be represented in standard IT health colors (e.g., orange represents Warning while Red is Critical). |
[[File:Grid Dashboard - Tab.jpg]] | [[File:Grid Dashboard - Tab.jpg]] | ||
Revision as of 14:35, 2 May 2023
Contents
Grid Dashboard Overview
The Grid Dashboard found on the Main Tab gives a quick visual overview of the Grid's health status. Alert messages can be quickly viewed. Power status and System temperatures are displayed. Network connections and Pool status are also visible. The color of the System Tile's Alert button will be represented in standard IT health colors (e.g., orange represents Warning).
Note: Overview Tiles with Alerts will be will be represented in standard IT health colors (e.g., orange represents Warning while Red is Critical).
"Graph" Check box
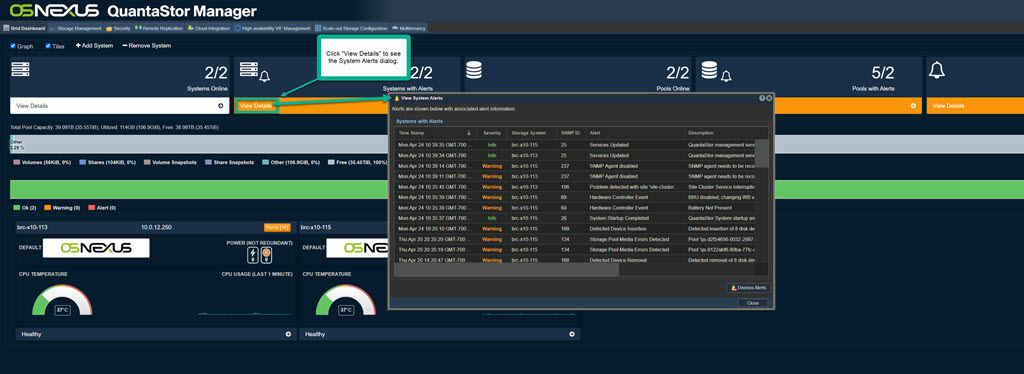
The graph check box shows tiles for Systems Online, Systems with Alerts, Pools Online, Pools with Alerts, and Alerts. Tiles with Alerts will be orange. To see details click "View Details".
"Tiles" Check box
With the "Tiles" box checked only tiles are displayed.
System Alerts
System Alerts are shown in an orange box.
The details can be accessed via a click on "View Details" as shown below. When there are no alerts for a System the background will be white.
+Add System
The "+ Add System" button brings up the Add System to Storage Grid dialog to add additional systems to the grid.
-Remove System
The "- Remove System" button brings up the Remove System from Storage Grid dialog to remove a system from the grid.


